
Security control effectiveness is a metric that shows how well an organization's existing security controls and defense measures prevent, detect, or respond to a cyberattack. It reflects how closely control performance aligns with the organization's security plan and its ability to manage risk within current risk tolerance levels. It is measured with Breach and Attack Simulation (BAS), which safely runs known malicious payloads and adversary techniques against production controls, and it is expressed as the percentage of simulated attacks a control blocks, logs, or alerts on.
Most security programs can list their controls. Far fewer can say what those controls actually stop. This article covers how security control effectiveness is measured, why it decays over time, how it differs from penetration testing, and what our latest first-party data says about where enterprise controls are failing.
The three dimensions of security control effectiveness: prevention, detection, response
A security control is any mechanism designed to reduce risk: a next-generation firewall, an EDR agent, a secure email gateway, a WAF, a SIEM detection rule, an identity policy. Each one is deployed with an implicit promise about what it will stop or surface.
Security control effectiveness tests that promise. It asks three questions about a specific adversary behavior, in sequence:
-
Prevention: Did the control block the action?
-
Detection: If not, did the action produce a log, and did that log produce an alert?
-
Response: If an alert fired, did it reach a person or workflow that could act?
The result is a score for how a control performs against a specific threat, whether that threat is a known malicious payload hitting the perimeter or an attacker technique executing on the endpoint, in a given environment, at a given point in time.
What a security control effectiveness score can and cannot tell you
A security effectiveness score answers one narrow question: how this control performed against this threat, here, now. Two things cannot be inferred from it.
Do MITRE ATT&CK Evaluations reflect real-world security control effectiveness?
Not directly. MITRE ATT&CK Evaluations and similar independent tests show what a product can achieve under controlled conditions. They do not prove how that product will perform in your production environment, where configuration drift, exclusions, integrations, and operational constraints change the outcome.
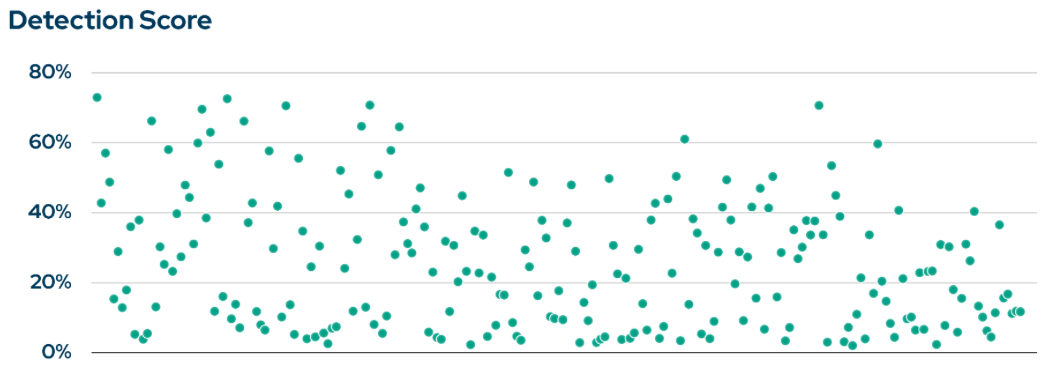
Figure 1. Real-World Performance of Cybersecurity Products. Source: Blue Report 2026.
In production, the agent may be missing from some hosts or running without system privileges, a temp directory may be excluded to quiet false positives, and several detections may sit in alert-only mode because blocking them would interrupt a sysadmin's scripts. Two organizations running the same EDR under these conditions produce two different scores, and neither matches the benchmark.
Figure 1 shows exactly this: customer environments running the same class of security products span from near 100% prevention to near the bottom of the scale.
Why does the same control score differently against different threats?
Because a control stops a threat only when it carries logic that recognizes that threat, and coverage is uneven: strong for some behaviors, missing or deliberately relaxed for others.
In the Blue Report 2026, enterprise controls prevented Privilege Escalation at 79% and Initial Access at 74%, while preventing Discovery at only 36% and Exfiltration at 39% (Figure 2). The score depends less on the product than on which behaviors it was configured to cover.
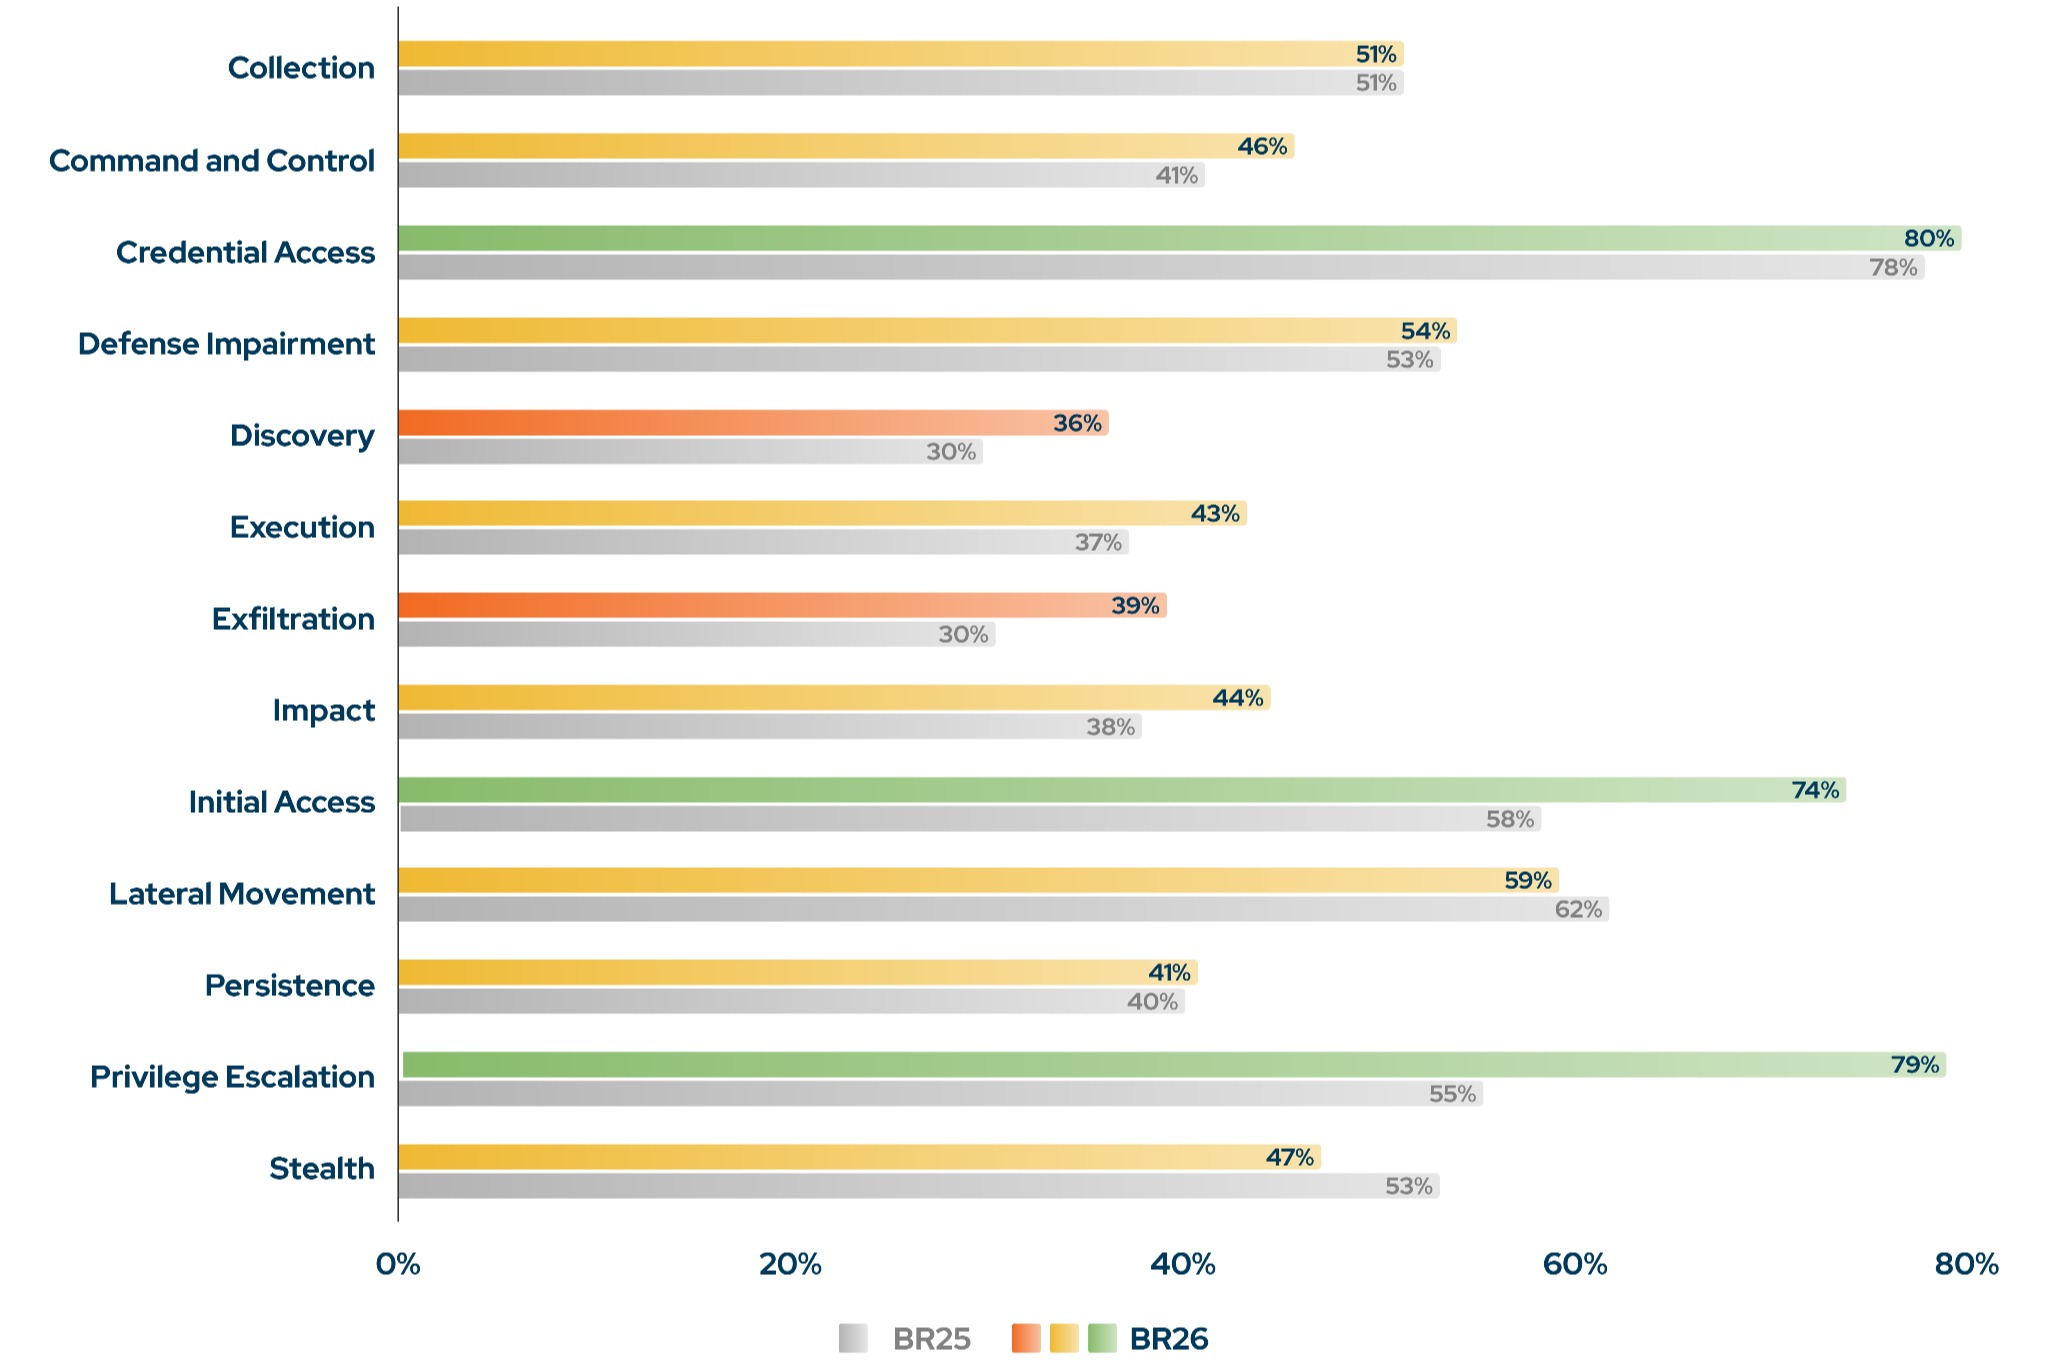
Figure 2. Prevention effectiveness by MITRE ATT&CK tactic. Source: Blue Report 2026.
Coverage falls short in three recurring ways:
- The behavior has no malicious artifact. An RDP login with valid credentials, a round of account enumeration, or data leaving over HTTPS looks like ordinary activity. Catching it requires context, such as a session from a host that has never used RDP or enumeration at a volume no admin task needs, and most detection content has not been built to that depth.
- The logic exists but is not enforced. Many of these behaviors sit in a gray area where blocking would also block a sysadmin's script or an admin's remote session, so the control is left to log or alert rather than prevent. The prevention score records that trade-off.
- The signal is obvious and nobody wrote the rule. Clearing shell or event-log history has almost no legitimate explanation, yet Impair Command History Logging was prevented in 1% of simulations.
The threat decides how hard the rule is to write. Whether it exists, and whether it is enforced, is decided by the defender, and security control validation is how you find out the answer threat by threat, before an attacker does.
How security control effectiveness is measured
Security control effectiveness is measured with BAS. Simulated attacks are run safely against production security controls, and each attack answers three questions in order.
- Did a control block it?
- If not, did the EDR or SIEM log the behavior?
- If it was logged, did a detection rule turn that log into an alert?
The first question measures prevention; the second and third measure detection, because a logged behavior that never produces an alert is visibility without detection. The Blue Report quantifies these two dimensions through prevention, log, and alert scores.
Response effectiveness can be validated separately by exercising the alert-to-action pipeline end to end: does the alert reach the workflow expected to contain the attack, and does that workflow fire.
What is prevention effectiveness?
The percentage of simulated attacks that security controls blocked.
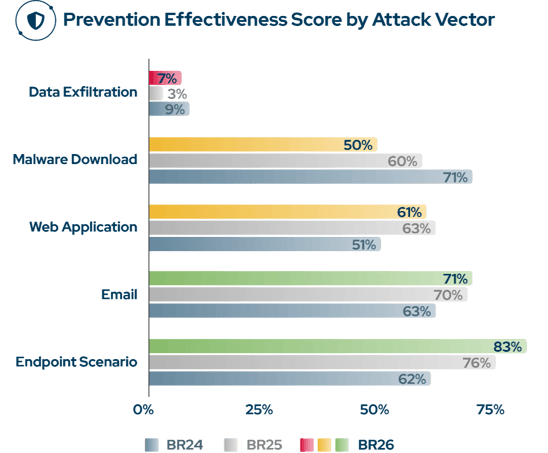
Figure 3. Prevention Effectiveness Score by Attack Vector. Source: Blue Report 2026.
The Blue Report breaks it down across five attack vectors, each exercising a different layer of the stack:
- Malware download retrieves known malicious payloads over the network and tests static content inspection at the perimeter. The report calls this the IOC-based prevention rate: the control either recognizes the payload or it does not. 2026: 50%.
- Email infiltration tests email security gateways with malicious attachments and URLs. 2026: 71%.
- Web application tests WAF tuning and input validation against application-layer attacks. 2026: 61%.
- Endpoint executes adversary techniques on the host and tests EDR and policy hardening. This is TTP-based prevention: the question is whether the behavior is stopped, whatever the payload. 2026: 83%.
- Data exfiltration tests outbound monitoring and traffic filtering with simulated data theft. 2026: 7%.
Across all simulated attacks, the 2026 prevention score is 69%.
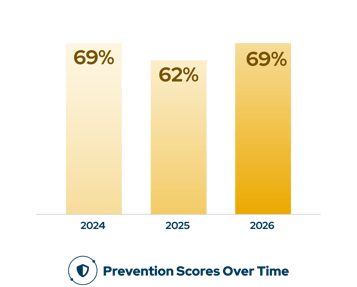
Figure 4. Prevention Scores Over Time. Source: Blue Report 2026.
What is detection effectiveness?
Whether SIEM and EDR platforms identified the simulated behavior, reported as two scores because logging and alerting fail for different reasons:
- Log score: the percentage of simulated attacks whose behavior was logged. 2026: 58%.
- Alert score: the percentage that generated an alert from a detection rule. 2026: 14%.
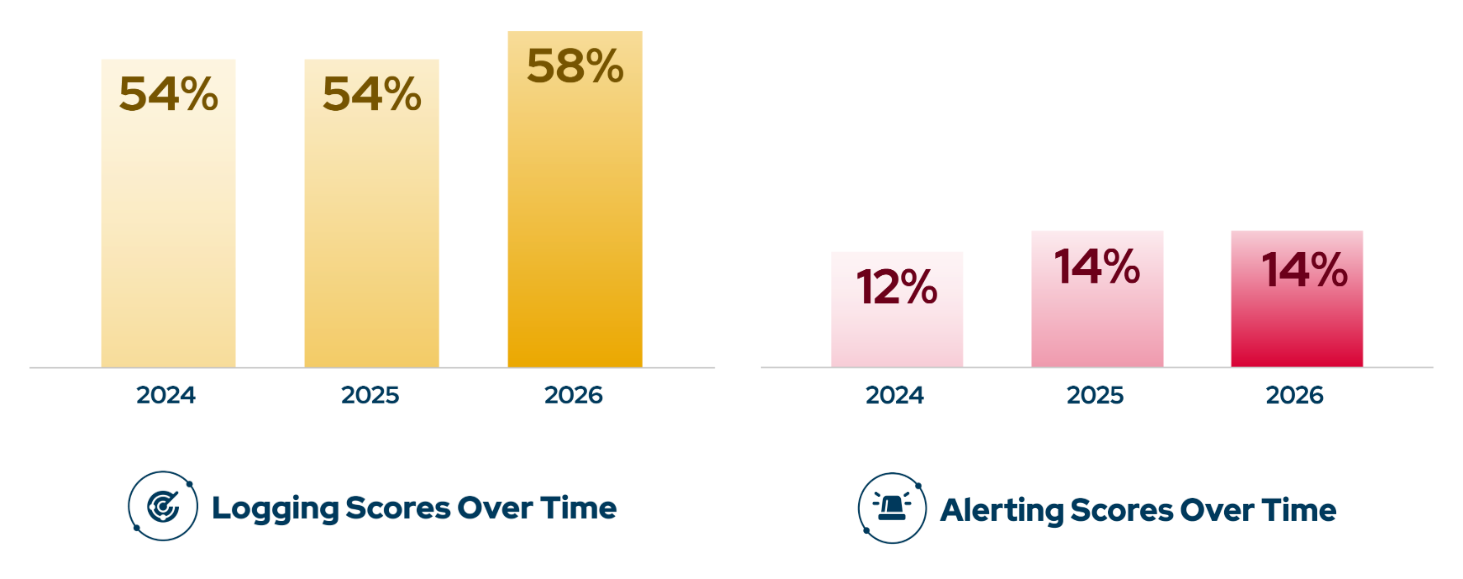
Figure 5. Logging and Alerting Scores Over Time. Source: Blue Report 2026.
A behavior can be logged and never alerted on; the 44-point gap between those two scores is the most persistent weakness in enterprise detection.
How are scores classified?
Five levels: Optimized (90–100%), Managed (70–89%), Moderate (40–69%), Basic (20–39%), Inadequate (0–19%). The 2026 enterprise average is Moderate on prevention and logging, and Inadequate on alerting.
Because every simulation is mapped to MITRE ATT&CK, the same scores are reported by tactic, technique, industry, and region. That is what makes the number diagnostic: 69% overall becomes 79% for Privilege Escalation and 36% for Discovery, and the gap tells a team where to work.
BAS vs. penetration testing vs. vulnerability scanning
The terms are often used interchangeably. They measure different things, and treating one as a substitute for another leaves a blind spot.
|
Security control validation (BAS) |
Penetration testing |
Vulnerability scanning |
|
|
Question answered |
Do my controls block, detect, and alert on this behavior? |
Can an attacker chain exposures to reach a target? |
Which known vulnerabilities exist on my assets? |
|
Object measured |
The security control |
The exposure and attack path |
The asset's software state |
|
Visibility into prevention and detection stack |
Full: telemetry, alerting, response |
Very limited |
None |
|
Output |
Per-control, per-technique effectiveness score |
Proof of compromise |
Severity-ranked findings list |
Penetration testing, manual or autonomous, proves that an attack path is real. It is essential for that purpose. But it does not tell you whether your EDR policy would have alerted, whether your SIEM rule fired, or what to change in your firewall. Its job is validating exposures, not improving controls.
A pentest that fails to breach you does not mean your controls are effective; it means that path was closed. Security control effectiveness requires testing the controls themselves.
Why does security control effectiveness decline over time?
Because detection content, controls, and adversaries all change after deployment. The Blue Report 2026 measures each, and the patterns behind the numbers will be familiar to anyone who has kept a security stack running in production.
Detection content breaks
The log score rose from 54% in 2025 to 58% in 2026, while the alert score stayed at 14% for a second year: organizations capture more attacker behavior than ever and alert on the same small share of it.
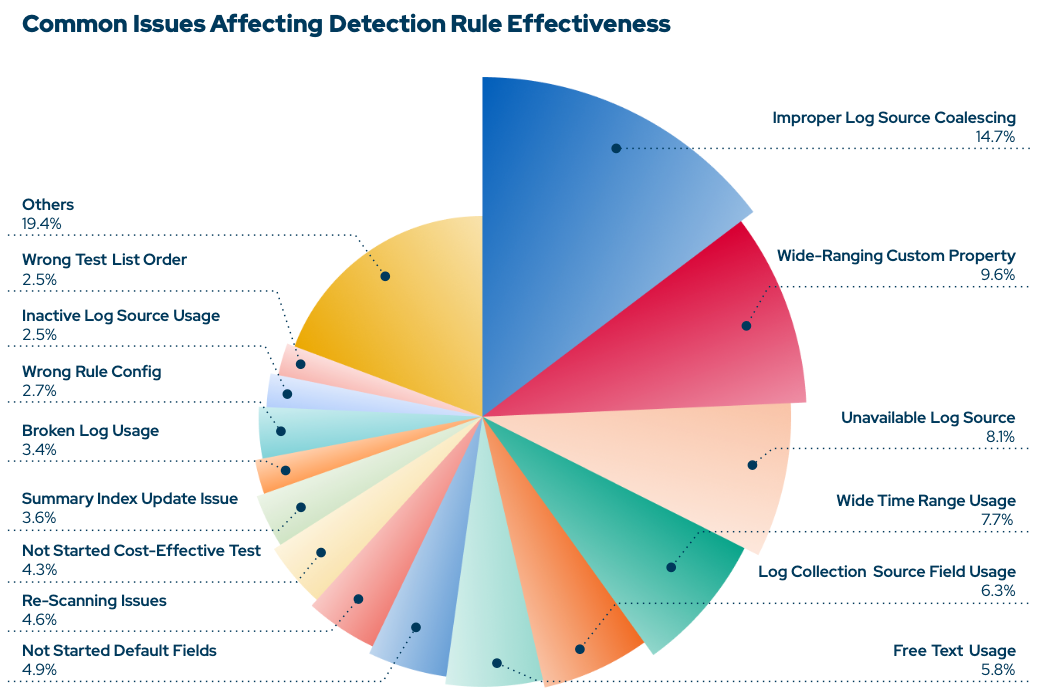
Figure 6. Pie Chart for Common Issues Affecting Detection Rule Effectiveness. Source: Blue Report 2026.
The report's analysis of detection rules shows where the loss happens.
- Performance problems, rules too slow to run or too noisy to trust, became the leading cause of rule failure in 2026 at 49% of all issues, up from 24% in 2025.
- Log collection problems were another 41%, the largest single one being Improper Log Source Coalescing at 15%, a setting that compresses or drops events before any rule sees them.
In practice this is the difference between an attacker clearing the local Windows event log and finding a copy already forwarded to a syslog server, or finding nothing there at all.
Security controls drift
A common pattern in EDR and XDR deployments: after a wave of false positives, a single overloaded sysadmin adds an exclusion for the temp folder. The console stays green, and attackers drop payloads exactly there. Agents missing from some hosts, or running without system privileges, widen the same gap. This is how environments running the same products end up spanning from near 100% prevention to near the bottom.
Indicator-based prevention loses ground
Malware download prevention fell from 71% in 2024 to 60% in 2025 and 50% in 2026. A known sample with one string changed and recompiled no longer matches its hash-based signature, and VirusTotal sees nearly two million new files a day. IOC-based testing still confirms the perimeter recognizes known-bad; it has to be paired with TTP-based validation of the behavior underneath.
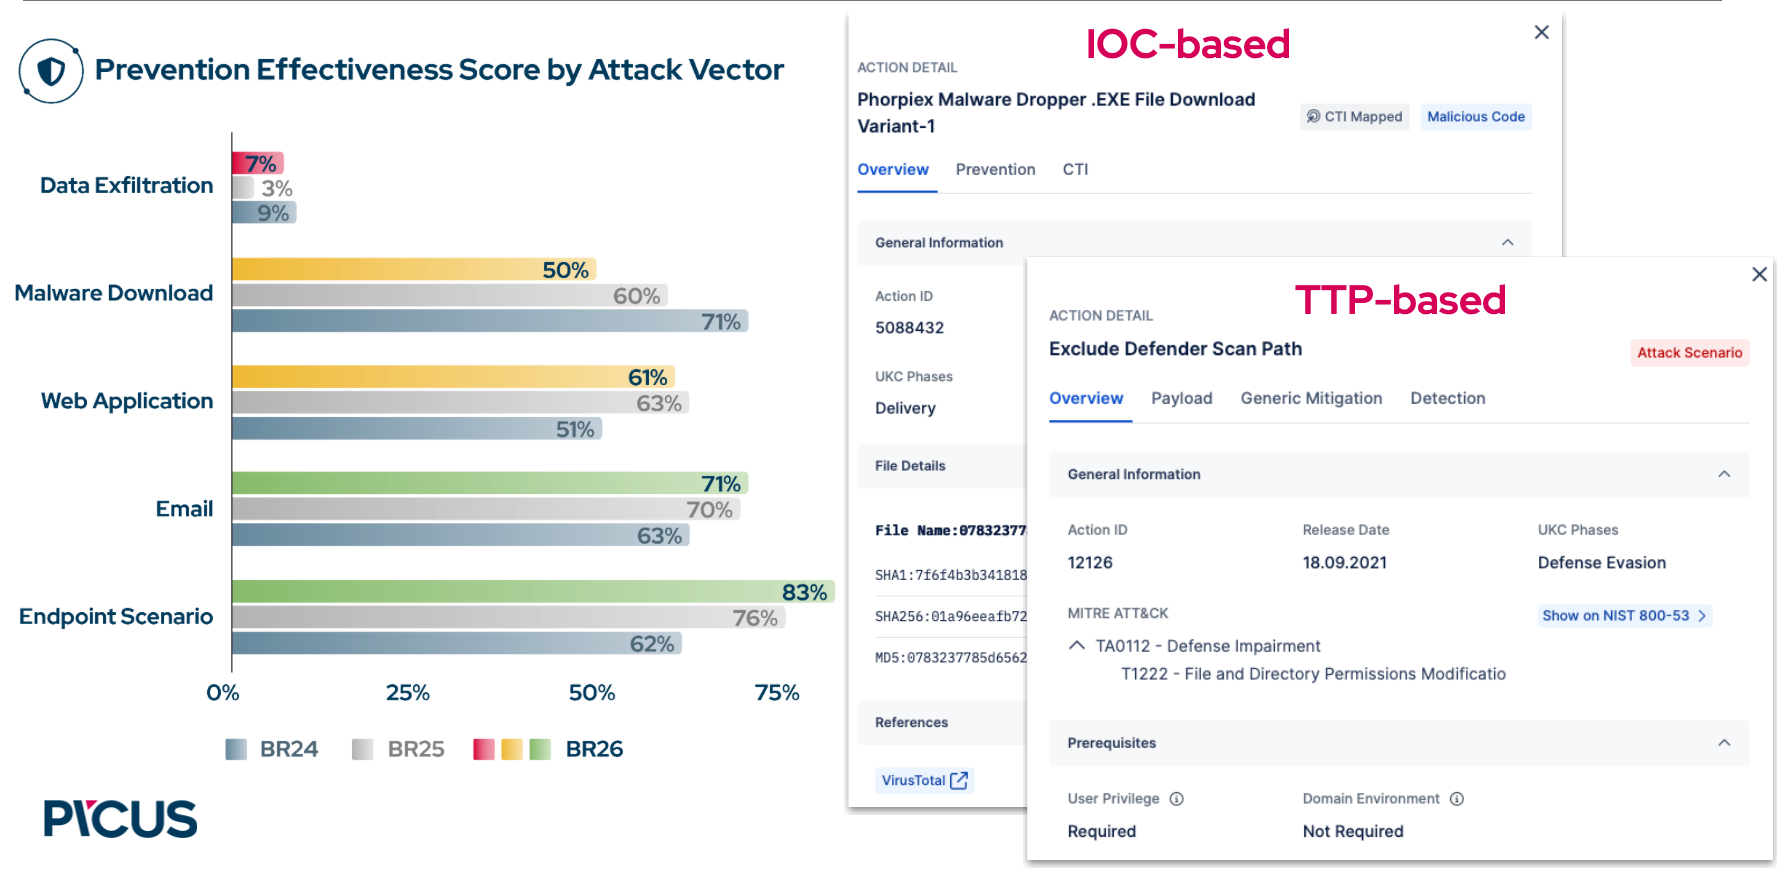
Figure 7. Malware Download Attempt Prevention Score Over Years. Source: Blue Report 2026.
Adversaries move toward what controls miss
The most telling number in the Blue Report 2026 is a contradiction: overall prevention rose seven points, and prevention against the ten least-stopped threat groups fell, against nine of the ten. The same year defenders got better in aggregate, the adversaries who matter most got through more often. Play ransomware shows how: half of environments stopped it in 2025, one in eight in 2026, after it moved to intermittent encryption and legitimate tools.
The defenses did not get worse. The threat stopped looking like what they were tuned to recognize, and the simulations, updated to Play's current tradecraft, are what exposed the gap. A control tuned against last year's version of an adversary and left there has, in effect, not been tested against this year's.
How to improve security control effectiveness
Picus Labs' data makes one argument in several forms: effectiveness is restored by testing, and lost by stopping. Its recommendations follow from that.
-
Expect degradation and plan for it. The seven-point recovery in 2026 was not new tooling; it was organizations re-testing controls that had drifted and fixing what they found. The same mechanism runs in reverse the moment testing stops.
-
Engineer detection, do not just collect. 58% logged against 14% alerted says telemetry is being bought and rules are not being maintained. Write rules against current behavior, prove they fire, tune the noise out, re-validate on every change. Collection without analytics is visibility wasted.
-
Validate behavior, not indicators. Malware download prevention at 50% is a signature problem. Test whether controls stop what a payload does, and pair every IOC-based perimeter test with a TTP-based one behind it.
-
Test the chains adversaries actually run. No leading ransomware family scored above 38%. Single techniques pass; current, full kill chains for the groups that target your sector are the test that matters.
-
Put stealth at the front of the queue. Stealth was one of two tactics to decline, and the technique that erases logs was stopped 1% of the time. Validate first against what is quiet.
Why Picus BAS is the Best Tool for Measuring Security Control Effectiveness
The Blue Report findings in this article were produced by Picus Breach and Attack Simulation. It is the instrument behind four years of the Blue Report and more than 300 million simulations in the first half of 2026 alone, and it was built for exactly the problems the data exposes.
It measures the whole stack, at every layer
IOC-based tests against the perimeter, TTP-based tests on the endpoint, and detection validation in the SIEM, including the health of the rules themselves: whether they fire, how fast, and at what cost. Cloud validation runs agentless across AWS, Azure, and GCP, with Kubernetes validation alongside.
It keeps pace with the adversary
Picus Labs, a 50-person research team, ships emerging threats as runnable simulations within 24 hours, and AI Threat Builder turns a threat report into an ATT&CK-mapped simulation in about nine minutes.
It closes the gap it finds
Every failed simulation comes with the vendor-specific signature, detection rule, or configuration fix for the control that missed it, and a one-click re-test proves the fix worked. With Picus Swarm, re-testing fires on signal, a new threat, a policy change, a control update, rather than on a calendar, with your team approving at the decision gates.
It is measured by what customers report and how the market rates it
Twice the control effectiveness within 90 days on the same stack: on average 128% more prevention and 72% more detection without a new product added.
- Gartner Peer Insights names Picus a Customers' Choice 2026 for Adversarial Exposure Validation, with a 4.8/5 rating and 98% of users willing to recommend across 154 reviews, the largest review base of any vendor in the category.
- Frost & Sullivan places Picus first on both the Innovation Index and the Growth Index in its 2026 Frost Radar for Automated Security Validation, and named it Global Automated Security Validation Company of the Year 2026.
- G2 rates Picus 4.8/5 and lists it as a Fall 2026 Leader for Enterprise and Mid-Market, with Best Relationship and Momentum Leader badges in Mid-Market.
- Cybersecurity Excellence Awards 2026 Winner.
Security control effectiveness is measured, or it is assumed
Every control in your stack is either proven or assumed, and the Blue Report 2026 shows how far apart those two states have drifted: two in three attacks prevented, one in seven alerted on, and the gap widening against the adversaries that adapt fastest. The margin for assumption is closing. After Mythos, frontier AI models turned into machine-speed, autonomous attackers: the mean time from disclosure to exploitation collapsed from 21.5 days in 2025 to roughly eight hours in 2026, and the attack chains those models produce rarely look like what your controls were tuned to recognize. A quarterly test answers a question that was asked months ago.
The organizations at the top of the distribution are not running different products. They are running the same tests continuously, at the speed the change arrives, with their team approving at the decision gates.
See what your controls actually stop. Book your free demo and get a baseline on your own environment within a day.


-3.png?width=353&height=200&name=image%20(79)-3.png)
.png?width=353&height=200&name=what-is-exposure-assessment-blog-preview%20(1).png)